Abstract
Strong leasing momentum translated into positive occupancy gains. Net absorption totaled 2.8M SF in Q2 2026, marking the fourth consecutive quarter of positive absorption.
Los Angeles
ECONOMY
Global trade patterns remained a key driver of economic activity during the second quarter as businesses continued adjusting supply chains amid evolving tariff policies and higher operating costs. Many
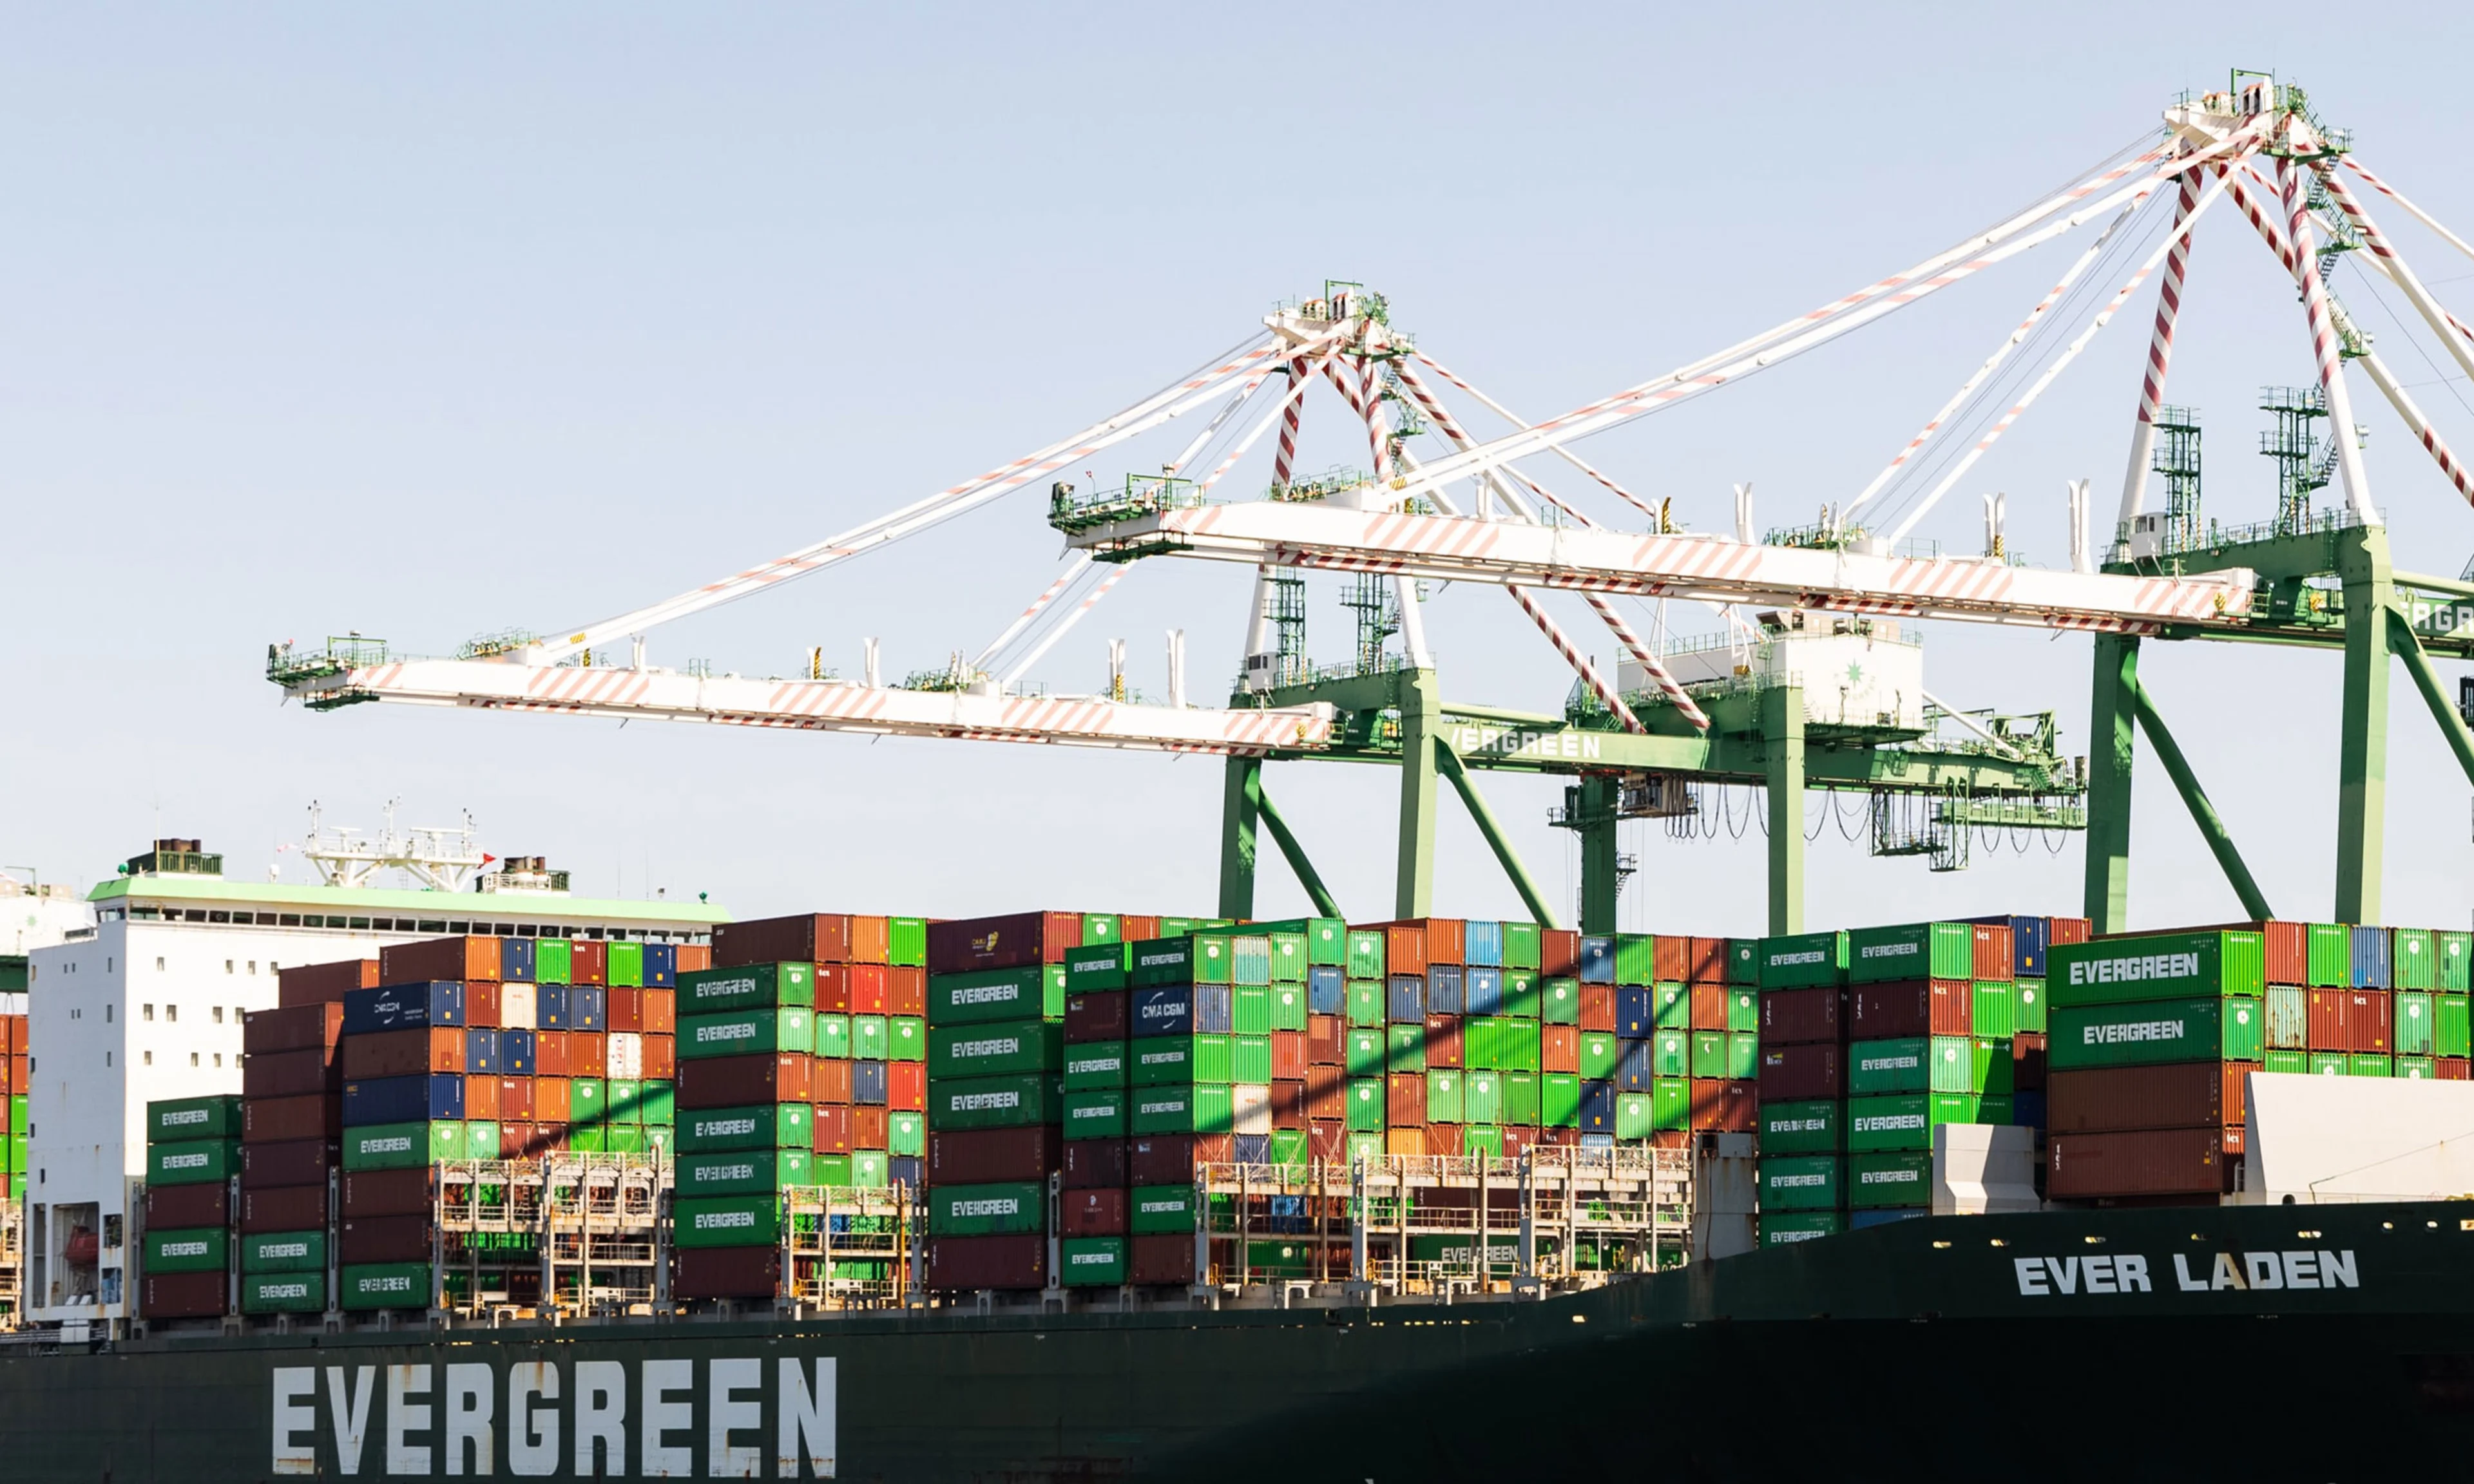
importers accelerated shipments to get ahead of potential trade actions, boosting cargo volumes through major U.S. gateways while creating uncertainty around shipping activity later in the year. At the same time, consumer demand remained stable, with spending continuing to favor essential and value-conscious purchases.The Ports of Los Angeles and Long Beach posted a strong recovery in May, processing a combined 868,221 loaded import Twenty-Foot Equivalent Units (TEUs), up 32.5% year-over-year (YOY) . Through the first five months of 2026, combined imports totaled 4.1 million (M) TEUs, a 2.2% increase from the same period in 2025.
The Greater Los Angeles industrial market continues to benefit from its position as the nation's primary gateway for international trade. The rebound in import activity has supported warehouse demand across the region. Although tenants remain selective and economic uncertainty persists, companies continue to prioritize infill locations that provide efficient access to the ports, population centers, and regional transportation infrastructure. These factors are helping maintain healthy leasing activity and reinforce the market's long-term fundamentals.
With new construction remaining limited, the market is better positioned to absorb available space while benefiting from its role as Southern California's primary gateway for international trade.
VACANCY
Overall vacancy continued to improve, declining to 4.5% in Q2 2026, down from 4.8% in Q1 and 4.9% throughout much of 2025. The 30-basispoint (bp) quarterly decline marks the most meaningful improvement
since vacancy began rising in early 2023.Market fundamentals vary across submarkets. The San Gabriel Valley remained the region's tightest industrial market with a 2.8% vacancy rate, followed by Central Los Angeles at 3.7%. In contrast, Mid-Counties recorded the highest vacancy at 7.5%, while the South Bay remained elevated at 5.8%, as these areas continue to absorb recently delivered space. Los Angeles North/Ventura recorded a 4.7% vacancy rate, closely aligning with the regional average.
Sublease availability remains well below year-ago levels despite a modest quarterly increase. Sublease availability rose to 7.1M square feet (SF), up 3.2% from Q1 2026. Even with the quarterly increase, sublease availability remains 22.3% below year-ago levels, indicating that much of the excess shadow inventory introduced over the past year has been absorbed or removed from the market.
Although vacancy remains above the long-term average of 3.2%, improving leasing activity, a disciplined development pipeline, and lower sublease availability are helping bring supply and demand into better balance.
With port activity strengthening and demand for well-located infill facilities remaining resilient, the Greater Los Angeles industrial market appears well positioned for continued stabilization through the remainder of 2026.
RENT
Average NNN asking rents declined to $1.27 per square foot per month (/SF/MO) in Q2 2026, down from $1.29/SF/MO in Q1 and $1.37/SF/MO one year ago. While landlords continue to adjust pricing to remain competitive, the pace of quarterly declines has moderated compared with the sharper corrections experienced during 2024-2025.
Despite declining over the past two years, asking rents remain well above pre-pandemic levels, increasing from $0.91/SF/MO in 2019 to $1.27/SF/MO in Q2 2026. This reflects the lasting impact of the unprecedented rent growth experienced from 2021 to early 2023, even after the recent market correction.
Vacancy has begun to trend lower while new construction remains limited, reducing downward pressure on pricing. Although tenants continue to have greater negotiating leverage than in recent years, strengthening demand and a slowing supply pipeline should help support rent stability over time.
Modern infill facilities in supply-constrained submarkets continue to command premium rents, while older properties and locations with higher vacancy face greater competitive pressure. As a result, landlords are increasingly relying on concessions and targeted pricing strategies to attract and retain tenants.
DEMAND
New leasing totaled 11.2M SF in Q2 2026, up 20.7% from Q1 and marking the strongest quarter since 12.2M SF was leased in Q2 2021. First-half leasing reached 20.5 M SF, up 31.6% YOY and representing the strongest first-half total since 2021.
The South Bay posted its highest quarterly leasing volume on record in Q2 2026, driven largely by advanced manufacturing occupiers. With 7.97M SF of leasing completed through mid-year, the South Bay has already nearly equaled its 8.1M SF full-year total from 2025, making it the primary contributor to Greater Los Angeles’ strong leasing performance.
Strong leasing momentum translated into positive occupancy gains. Net absorption totaled 2.8M SF in Q2 2026, marking the fourth consecutive quarter of positive absorption. Combined with 825,948 SF of positive absorption in Q1, the market has absorbed approximately 3.6M SF during the first half of the year, reflecting a meaningful improvement after several quarters of mixed occupancy trends. The sustained occupancy gains reflect strengthening tenant demand and indicate the market is steadily absorbing space added over the past two years.
The combination of record leasing volume, positive net absorption, and moderating new supply is helping improve market fundamentals and reduce available space. While tenants remain selective, demand for well-located facilities continues to strengthen, positioning the market for continued improvement through the remainder of 2026.
CONSTRUCTION
At the end of Q2 2026, approximately 3.8M SF remained under construction, down 55.2% from the market's peak of 8.4M SF in Q3 2023. Elevated construction costs, higher financing expenses, and a more disciplined lending environment continue to limit new speculative development.
Despite a more measured construction pipeline, the South Bay has experienced strong preleasing activity, particularly from advanced manufacturing and aerospace-related users. Healthy tenant demand for modern facilities in this supply-constrained submarket is providing developers with greater confidence to move forward on select projects.
New supply remains well below recent levels. Developers delivered 692,358 SF during Q2 2026, following just 191,517 SF in Q1. The slower pace of deliveries is helping reduce new supply pressure and allowing tenant demand to absorb existing available space.
With relatively few speculative projects underway and much of the remaining development concentrated in high-demand locations, new supply is expected to remain manageable. Combined with robust leasing activity and four consecutive quarters of positive net absorption, the disciplined pipeline should continue supporting market stabilization through the remainder of 2026.
Continue reading this report via the below PDF link.