Abstract
The East Bay industrial market remains tenant‑favorable in Q2 2026 with 8% vacancy, rents flat QOQ at $1.23/SF, negative absorption, and limited construction. Meanwhile, demand strengthens for modern Class A space and capital markets continue to improve.
East Bay
ECONOMY
In 2026, national employment in the warehouse and storage sector experienced a slight year-over-year (YOY) decrease. However, as of June 2026, approximately 1.8 million individuals are employed in this sector, marking a substantial increase of nearly 500,000 employees since 2020.
Many retailers, distributors, and logistics users are focusing on efficiency, leading some to pause hiring, delay expansion plans, or make better use of existing space. While these trends have weighed on employment growth in the near term, demand fundamentals remain relatively healthy, supported by the region’s role as a key distribution hub and ongoing activity from e-commerce, advanced manufacturing, and supply chain operators.
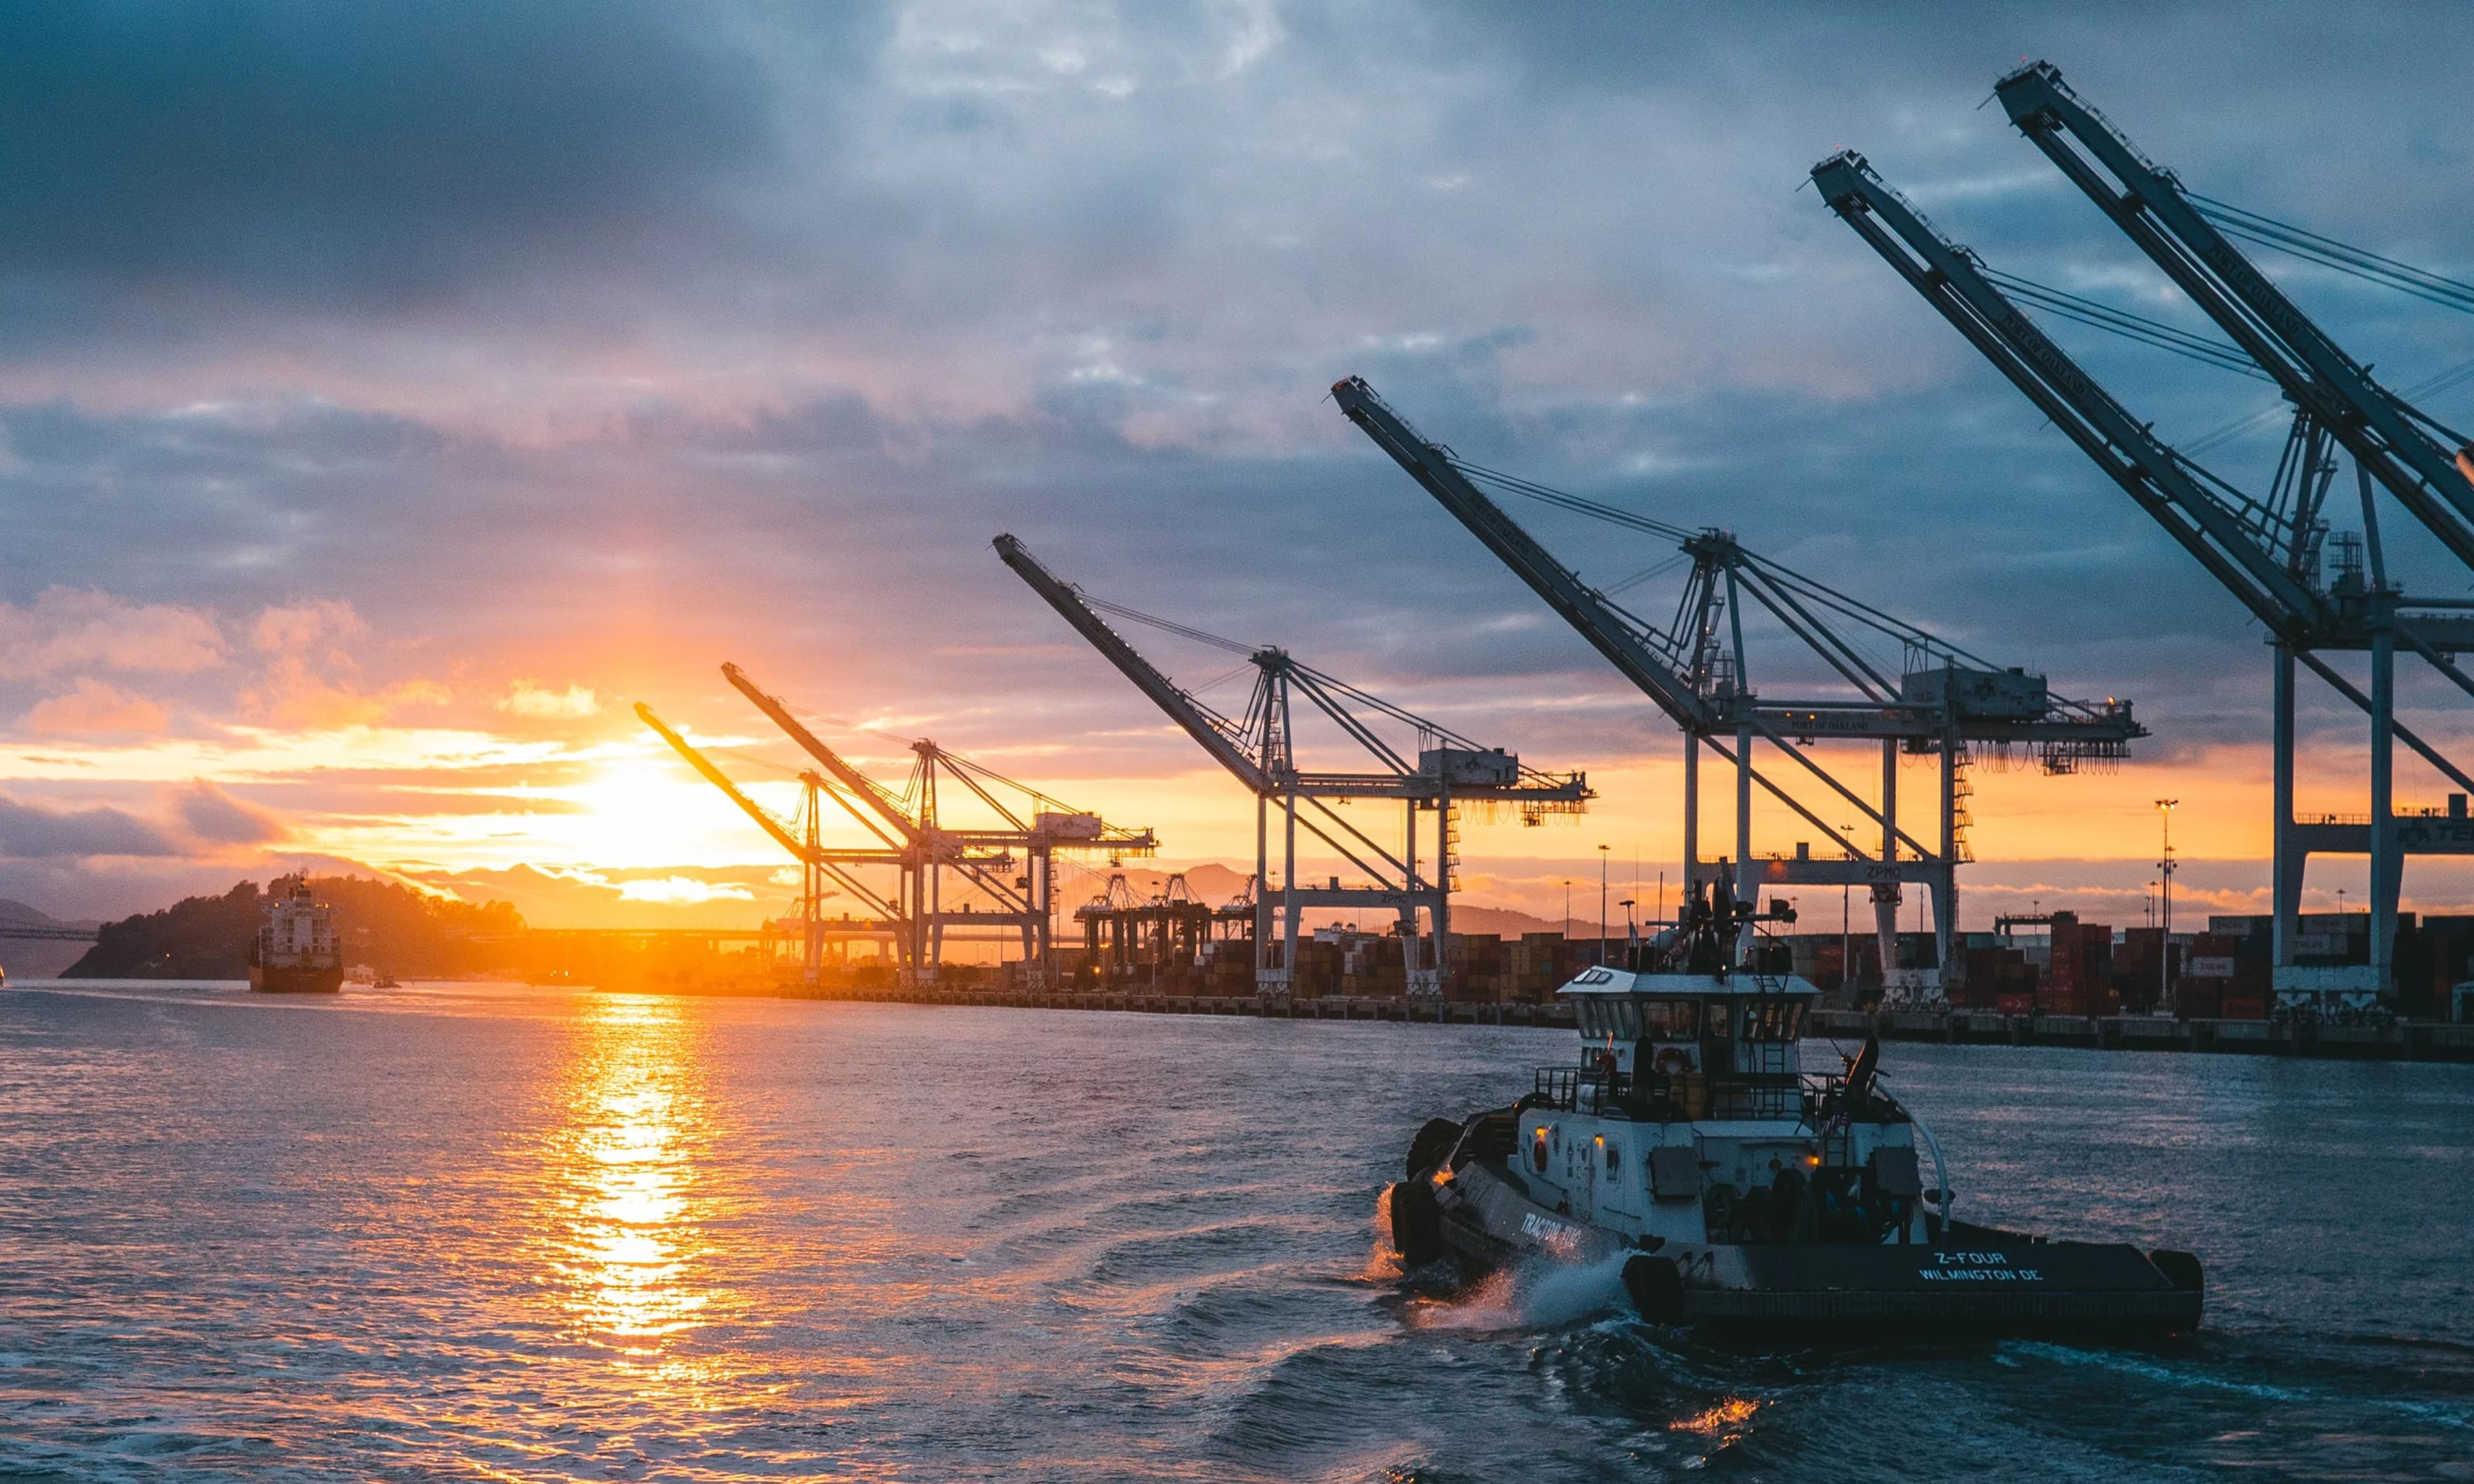
Port of Oakland container volumes have increased slightly in 2026 compared to 2025, with May import volumes rising 5.6% YOY. While reduced vessel capacity limited some inbound cargo, the port continues to serve as a critical trade gateway for Northern California and a leading hub for agricultural and refrigerated exports.
The port continues to face headwinds from global trade uncertainty, tariff-related cost pressures, carrier service adjustments, and ongoing competition from larger West Coast ports, which have created variability in container flows. Despite these challenges, the port’s specialized cold-chain infrastructure and strong agricultural export base have helped sustain cargo volumes and reinforce its importance to the regional logistics market.
VACANCY
The vacancy rate for warehouse buildings measuring 50,000 square feet (SF) or more has remained flat in Q2 2026 at 8.0%
In Q2, sublease vacancy rates also remained relatively flat on a quarter-over-quarter(QOQ) basis, bringing the current rate to 0.9%.
Elevated vacancy has continued to create a distinctively tenant-favored environment, enabling cost-conscious occupiers to secure competitively priced space without meaningful trade-offs in building quality or location. This dynamic allows tenants to align operational needs with budget priorities while reinforcing their negotiation leverage, as landlords compete to capture demand in an oversupplied market.
Higher vacancy levels persist in extending decision-making timelines, further slowing absorption.
RENT
Average asking rents ended Q2 2026 at $1.23 per square foot (/SF) per month. Rents have marginally increase on a QOQ basis where rents settled at $1.22/SF in Q1 2026.
In Q2, asking rents remained flat QOQ, as a modest improvement in demand was offset by high vacancy and abundant availabilities. Despite the slight increase in tenant activity, landlords held pricing steady but ultimately are focused on securing commitments in a market still characterized by excess supply.
A sizable inventory of Class B industrial space continues to weigh on the market, with executed deals regularly landing well below posted asking rents, often by 10%, as landlords adjust expectations to meet current pricing realities. Elevated vacancy has prolonged the leasing process, giving tenants the flexibility to compare multiple options, negotiate more aggressively, and delay commitments, further reinforcing a slow-moving, tenant-advantaged environment.
DEMAND
Net absorption totaled negative 523,841 SF during the quarter. This contraction in occupied space underscores a market still working through excess supply, with landlords facing longer lease-up timelines and heightened competition to retain existing tenants and capture the limited volume of active requirements.
Leasing momentum continues to improve across the market, led by healthy absorption of newly delivered Class A product with technology users and advanced manufacturers as the primary drivers of demand for high-quality, modern facilities. Touring activity remains steady QOQ for the 30,000–50,000 SF requirements. Tenant demand appears to be broadening across multiple size segments, signaling greater market engagement.
Despite the pickup in leasing activity, vacancy is expected to remain elevated in the near term as a significant amount of space is anticipated to hit the market from upcoming move-outs, consolidations, and lease expirations, creating additional back-end availability and sustaining competitive conditions for tenants.
Total leasing activity for Q2 2026 was 2M SF in buildings over 50,000 SF. This figure is currently above the leasing average from the last three years where the average quarterly leasing was 1.3M SF. Total leasing activity is up 400,000 SF QOQ where total leasing activity in Q1 totaled 1.6M SF.
CONSTRUCTION
Currently, 328,000 SF of speculative product is actively under construction, spread across two projects comprising a total of four buildings.
There is currently 2.4M SF of future development moving through the pipeline. The volume of planned construction indicates that developers anticipate strengthening fundamentals ahead and are positioning new projects to align with shifting tenant requirements as leasing activity gradually improves.
Many projects that previously stalled due to weak demand are now expected to advance toward breaking ground, as strengthening tenant interest is prompting developers to re-evaluate timelines and prepare long-planned sites for activation.
Landlords are actively investing in power upgrades across existing industrial facilities, recognizing that enhanced electrical capacity has become a key differentiation that expands the potential tenant pool and aligns assets with emerging high-power operational requirements.
CAPITAL MARKETS
Capital markets continue to improve as buyers and sellers have become more aligned on pricing.
Institutional capital remains active, with the deepest demand for modern industrial assets in strong infill locations.
Debt markets remain healthy, with lenders actively financing high-quality industrial opportunities.
Northern California remains a balanced market with 7.4% vacancy and average asking rents up 3.5% YOY.
Bay Area infill markets continue to command a premium, driven by limited supply, high barriers to entry, and strong long-term fundamentals.
Pricing has largely reset, with cap rates stabilizing and investors focused on well-located assets with durable cash flow.
Continue reading this report via the below PDF link.