Abstract
Loaded inbound containers, which are a key indicator of import demand, decreased by 3.7% to 3.24M TEUs from 3.36M TEUs last year. The decline suggests continued moderation in consumer imports and inventory replenishment activity.
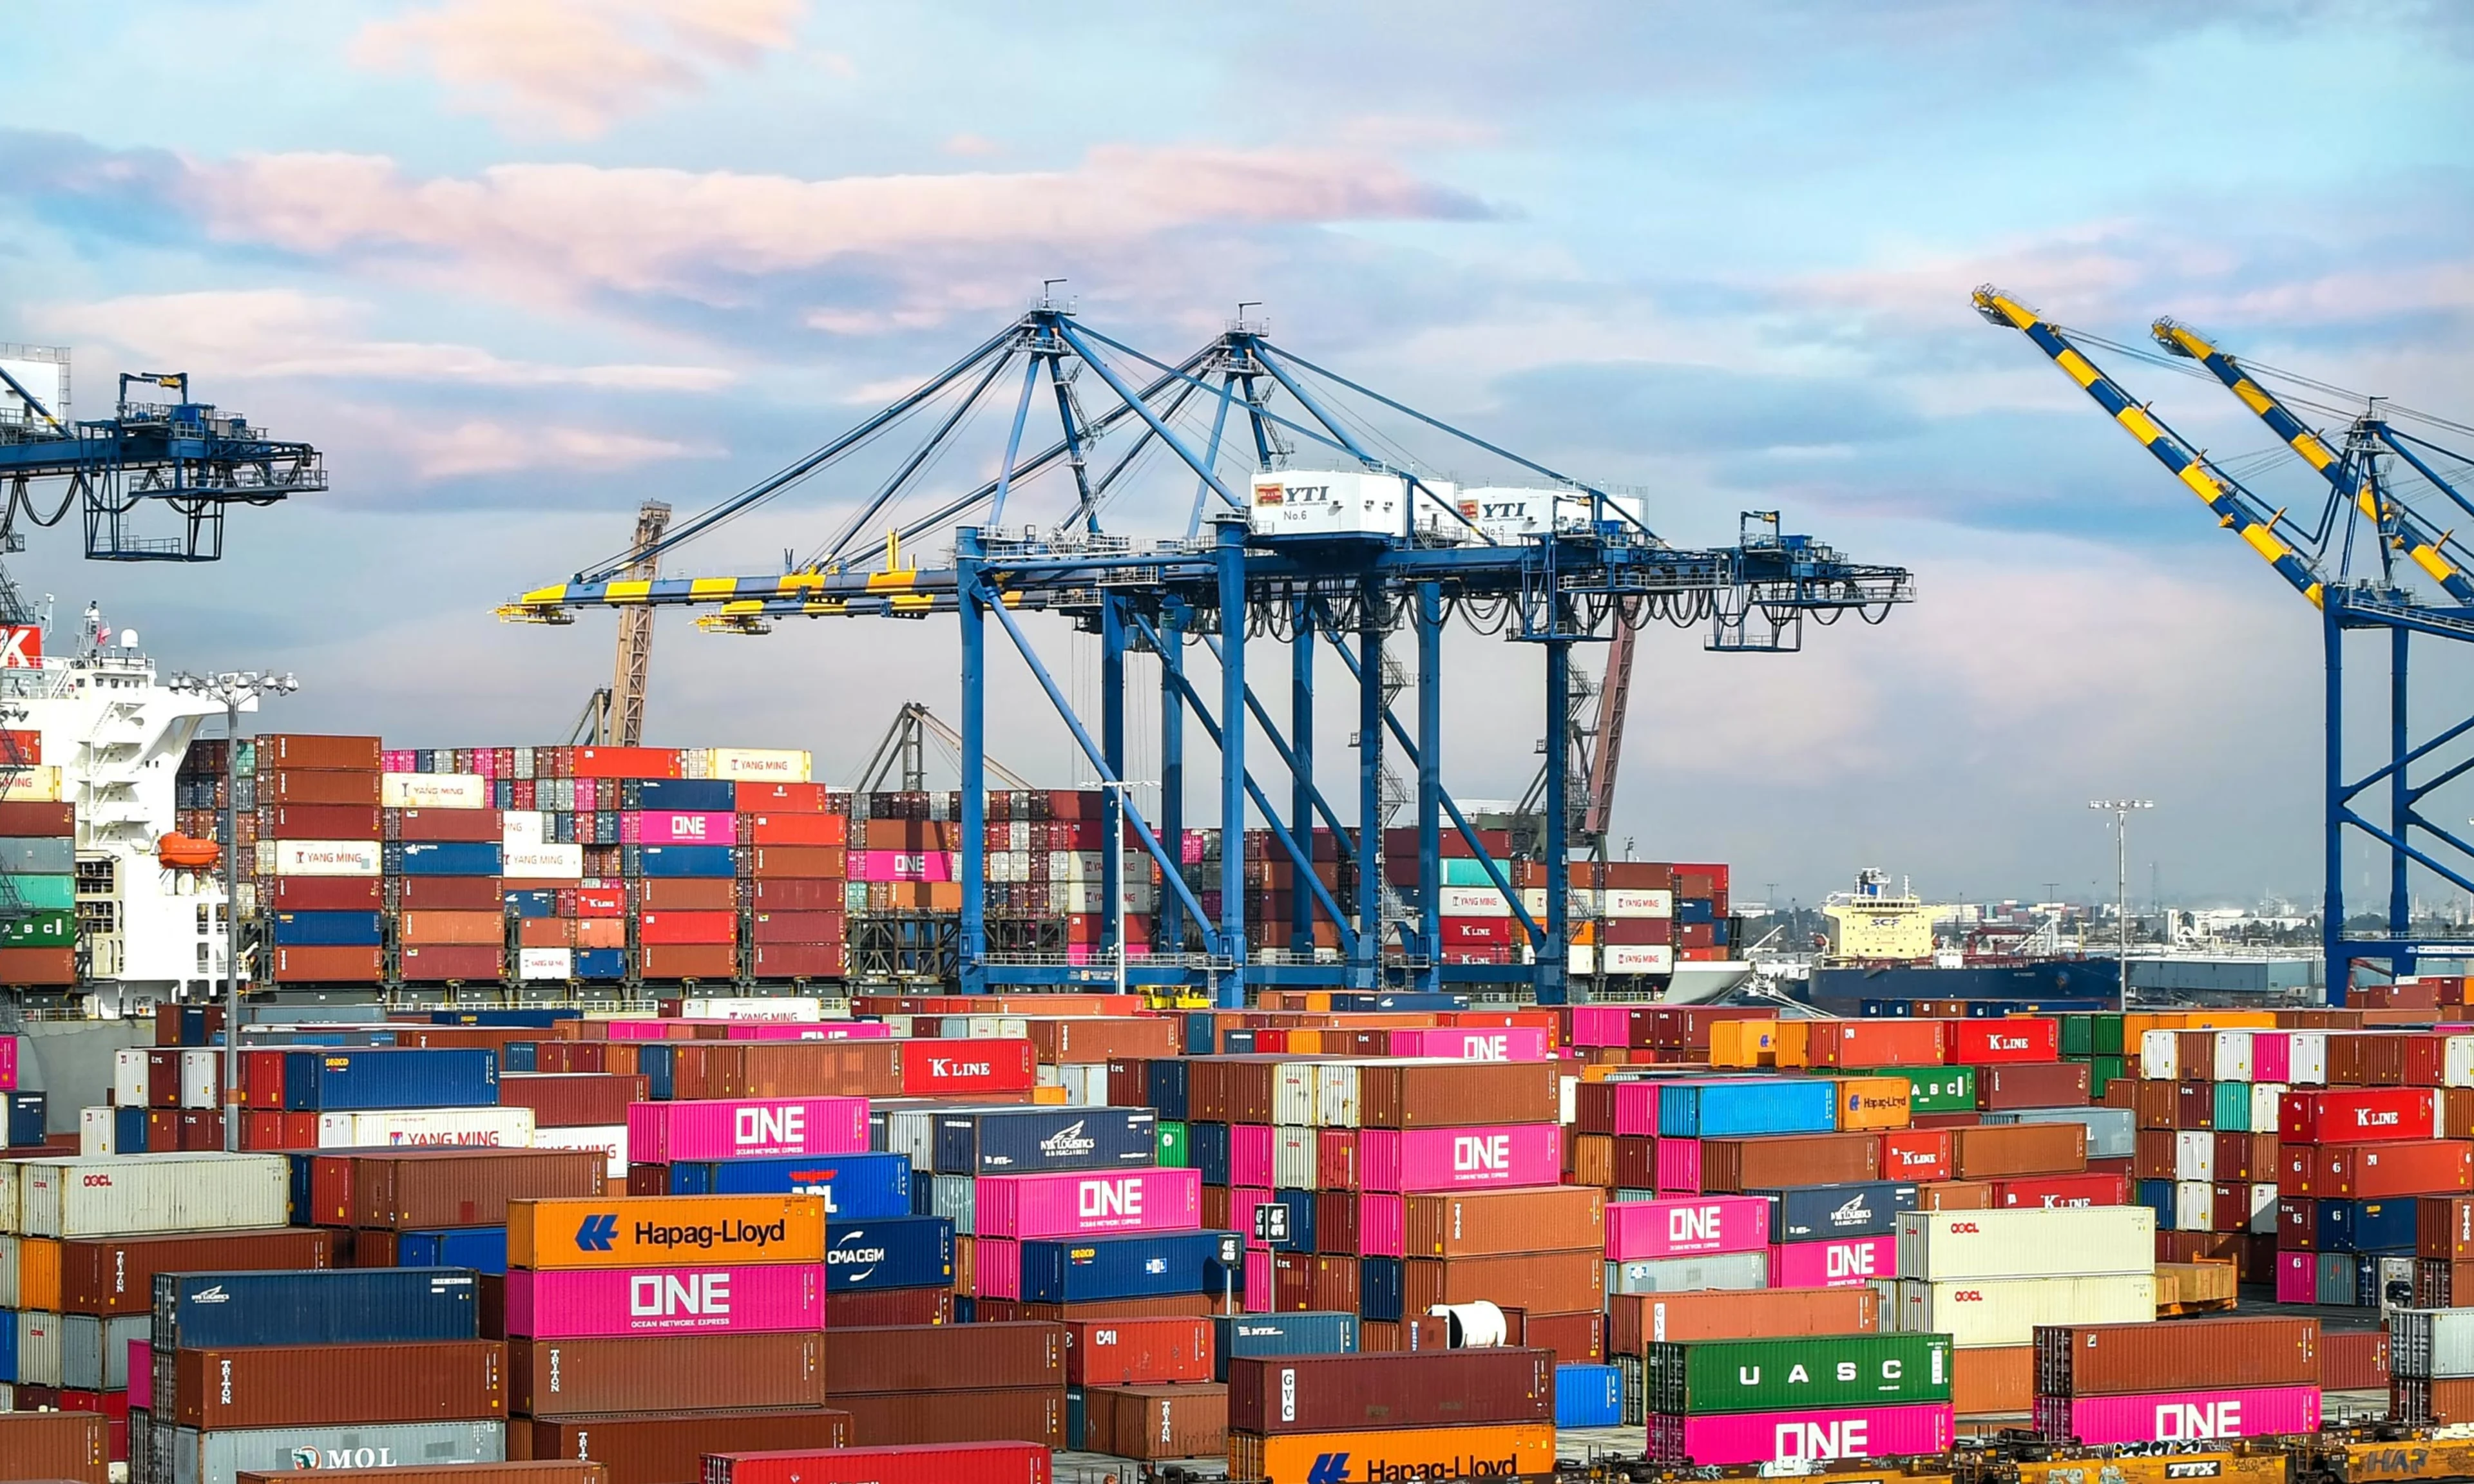
Ports of Los Angeles and Long Beach
PORT OF LOS ANGELES
The Port of Los Angeles marked its second-best April on record with 890,861 Twenty-foot equivalent units (TEUs), up 5.7% year-over-year (YOY). Through the first four months of 2026, the Port handled 3.28M TEUs, slightly ahead of its five-year average but 2.0% below last year’s elevated pace driven by cargo front-loading.
Strong import demand continued despite uncertainty surrounding tariffs and trade policy. April import volume was the strongest since September 2025. After a 1.2% YOY drop in March, the Port saw imports increase 4.7% YOY in April to 459,825 TEUs. However, year-to-date imports are down 1.5% YOY.
PORT OF LONG BEACH
April showed the strongest monthly recovery for the Port of Long Beach in 2026, with total container volume rising 5.6% from March to 817,993 TEUs. Despite the monthly rebound, April’s overall YOY performance remained below 2025 levels, declining 5.7% YOY.
Import volume also improved sequentially, increasing 4.1% from March to 389,835 TEUs, signaling stronger cargo movement entering the Port compared with the prior month. However, April’s imports are down 7.1% YOY, the ninth consecutive month of YOY decline. For the first four months of the year, imports are down 6.0% YOY.
Total container throughput reached 6.49M TEUs, down 3.9% YOY through April, reflecting softer cargo activity across the San Pedro Bay port complex. Loaded inbound containers, which are a key indicator of import demand, decreased by 3.7% to 3.24M TEUs from 3.36M TEUs last year. The decline suggests continued moderation in consumer imports and inventory replenishment activity.
Shipping fuel costs in Los Angeles are nearly 20% higher than at other major global ports and have risen sharply since the Iran conflict began. Fuel now accounts for about 25% of the cost of a voyage from Asia to Los Angeles, significantly increasing operating expenses for shipping lines. While carriers are taking measures to reduce fuel consumption and avoid costly routes, much of the added expense is expected to be passed on to consumers through higher product prices, contributing to inflation. Despite these rising costs, cargo activity at the Ports of Los Angeles and Long Beach — which handle more than $600 billion in annual trade — has remained relatively steady.
Provided statistical breakdowns include monthly and annual container counts measured in Twenty-Foot Equivalent Units (TEUs), a standardized maritime industry measurement used when counting cargo containers of varying lengths. Source: The Port of Long Beach and Los Angeles.
Continue reading this report via the below PDF link.